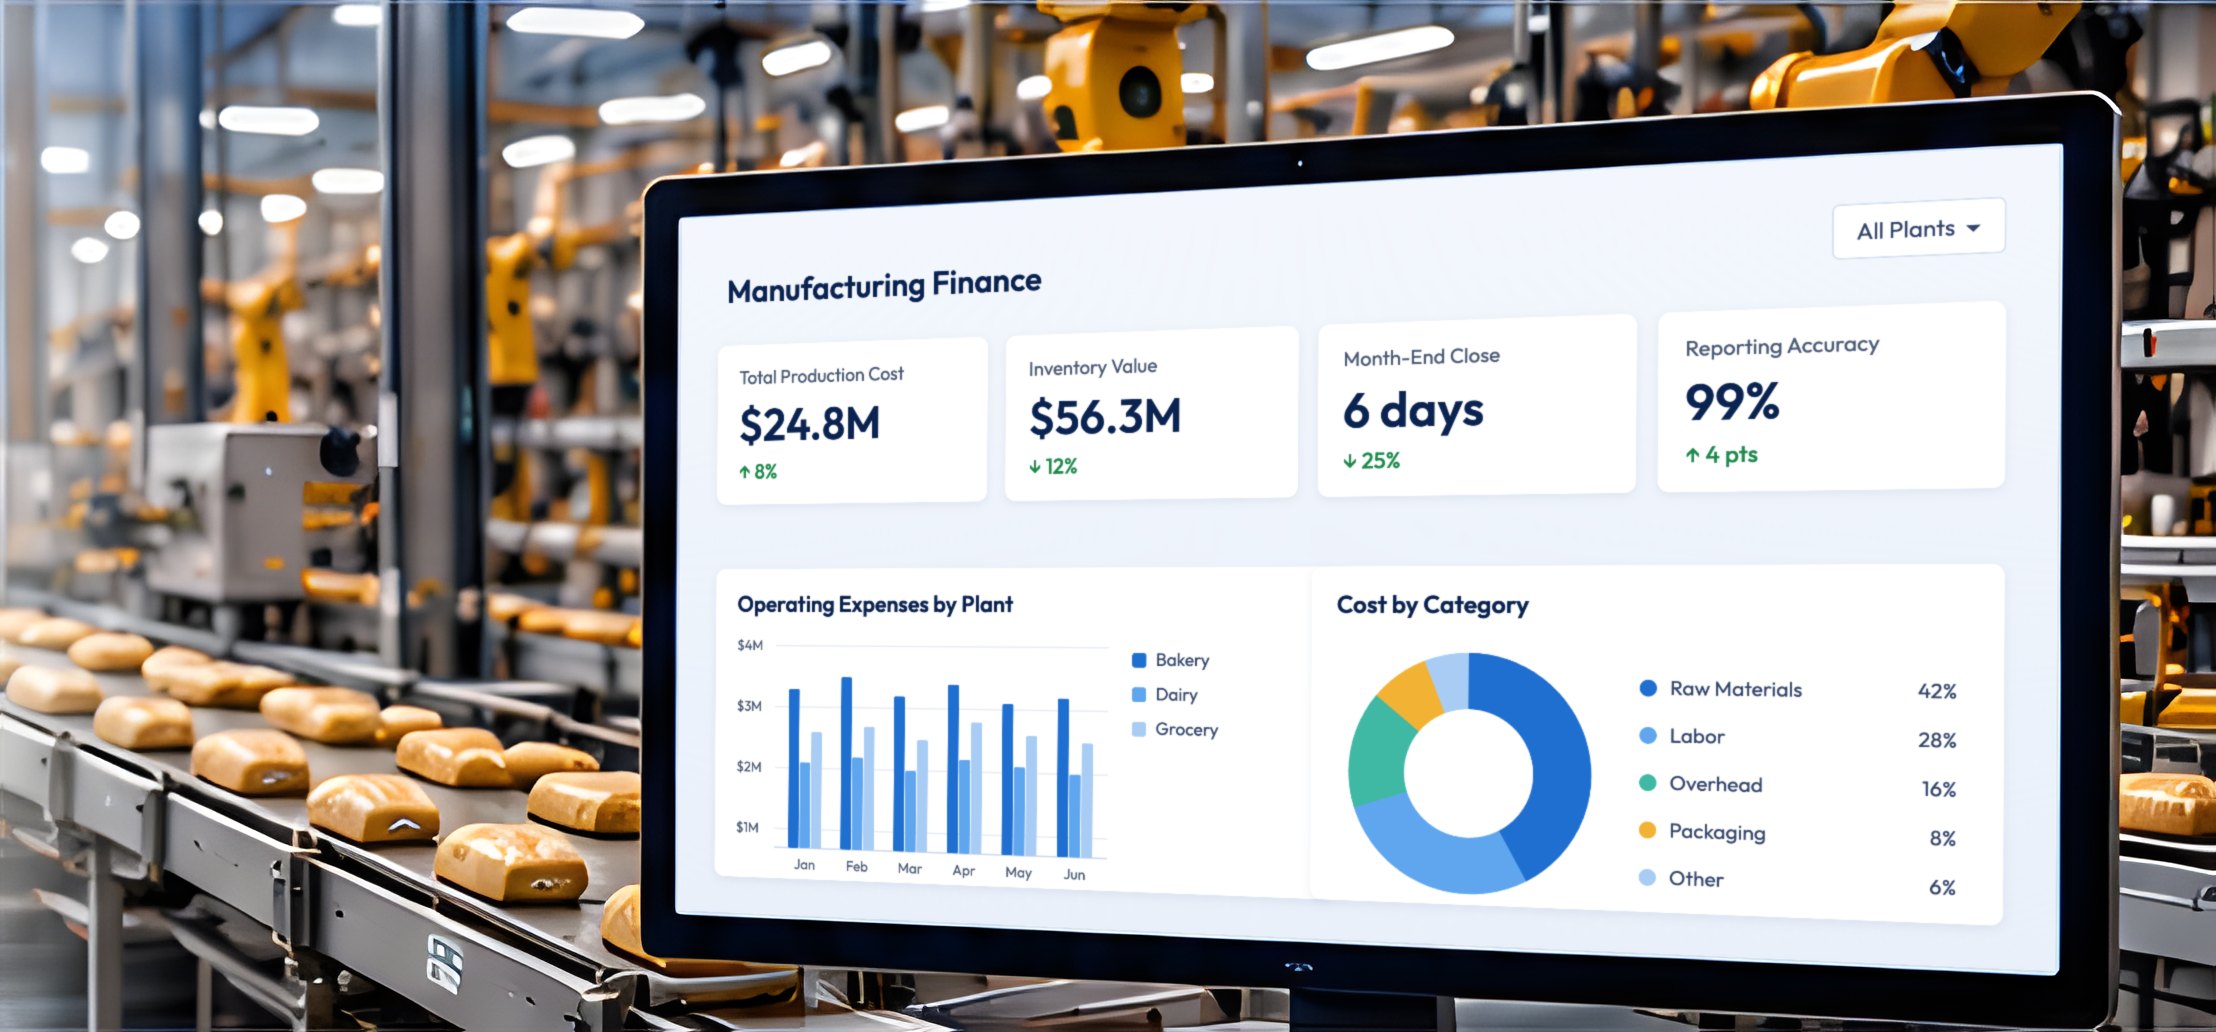
Finance dashboard on a monitor beside a bakery production line

WorkManufacturing Finance Platform Transformation

Case study

Manufacturing Finance Platform Transformation


From fragmented processes to a unified, scalable finance platform.

An illustrative case study demonstrating how I led the transition of multiple manufacturing plants to a new ERP system (Infor M3), standardized finance and accounting processes, consolidated data, and enabled faster, more accurate reporting and insights.

  • ERP Transformation
  • Manufacturing Finance
  • Process Standardization
  • Data & Analytics
01

Overview

Northstar Manufacturing (fictional) operates eight manufacturing plants producing Bakery, Dairy, and Grocery products for retail and foodservice customers across the US. Each plant had evolved its own finance and accounting processes, reports, and work artifacts over many years, resulting in fragmented workflows, inconsistent data, and limited visibility into overall performance.

I led the product strategy and execution for transitioning the company to Infor M3, while consolidating and automating finance processes, building a centralized data lake, and enabling standardized financial reporting and self-service analytics using Tableau. The goal was to create a unified, scalable finance platform that supports consistent processes across all plants, while accommodating business-specific needs where appropriate.

Key Outcomes (Targeted)

  • 30%Reduction in manual processes
  • 25%Faster month-end close
  • 99%Data accuracy in financial reports
  • 40%Increase in self-service reporting adoption
02

Business Challenge

The finance and accounting organization relied on a combination of legacy ERP systems, in-house applications, spreadsheets, and third-party tools across eight manufacturing plants. There was no centralized, standardized process in place, and each plant followed its own workflows, chart of accounts structures, and reporting formats.

Because of the nature of manufacturing outputs and the division into Bakery, Dairy, and Grocery plants, the differences in F&A processes were significant. Variations in production scheduling, inventory tracking, cost accounting, and reporting created inconsistencies in how financial data was captured, classified, and reported.

Leadership needed a unified finance platform and standardized processes to improve data accuracy, reduce manual effort, provide visibility across all plants, and enable faster, more informed decision-making.
Key Pain Points

  • Fragmented Processes

    No centralized, standardized F&A processes. Each plant followed its own workflows, approvals, and documentation.

  • Inconsistent Reporting

    Different report formats, definitions, and metrics across plants and product divisions (Bakery, Dairy, Grocery).

  • Multiple Systems

    Legacy ERP systems, in-house applications, and third-party tools with limited integration and data consistency.

  • Manual Work and Gaps

    High reliance on spreadsheets and manual data consolidation, creating process gaps and reconciliation errors.

  • Limited Visibility

    Difficulty obtaining a consolidated view of financial performance across plants, product lines, and cost centers.

  • Time-Consuming Reporting

    Ad hoc reporting requests required manual effort from plant teams, causing delays in analysis and decision-making.

  • Integration Uncertainty

    Lack of clarity on which in-house and third-party applications should be integrated with M3, replaced, or deprecated.

03

Product Vision

Bakery Plants(2 plants)
Dairy Plants(3 plants)
Grocery Plants(3 plants)
Infor M3Unified Finance PlatformStandardized ProcessesConsolidated DataAutomated ReportingSelf-Service Analytics
Consistent Processes
Single Source of Truth
Real-Time Reporting
Scalable for Growth

Standardize and automate finance and accounting processes across all manufacturing plants, consolidate data into a centralized platform, and enable accurate, consistent, self-service financial reporting and analytics.

04

Discovery & Analysis

  • Process Assessment

    Mapped current-state F&A processes across eight plants and identified key variations and gaps.

  • Application Inventory

    Cataloged in-house, legacy, and third-party applications, data flows, and integrations.

  • Stakeholder Interviews

    Partnered with plant controllers, finance teams, and IT to understand requirements and pain points.

  • Data Assessment

    Evaluated data sources, quality, and reporting needs, including Tableau use cases.

05

Key Decisions

  • Process Standardization

    Defined standardized F&A processes and chart of accounts across plants, with flexibility for plant-specific needs.

  • Application Strategy

    Determined which in-house and third-party applications to integrate with M3, replace, or deprecate based on business value and fit.

  • Data Lake Design

    Consolidated financial and operational data into a centralized data lake to enable consistent reporting and future analytics.

  • Reporting & Analytics

    Implemented standardized financial reports and self-service analytics in Tableau, reducing reliance on manual reports.

06

18-Month Product Roadmap

PhaseQ1Q2Q3Q4Q5Q6
Discovery & Planning
Process Standardization
Infor M3 Implementation
Data Lake & Integrations
Reporting & Analytics
Application Decommission
Change Management & Training
07

Expected Outcomes (Targeted)

  • 30%Reduction in manual processes
  • 25%Faster month-end close (from 8 to 6 days)
  • 99%Data accuracy in financial reports
  • 40%Increase in self-service reporting adoption
  • 20%Reduction in application maintenance costs
  • Foundationfor future AI and advanced analytics
08

Work Samples

Four key artifacts from this project illustrate my approach from strategy to execution.

  • 01Product Strategy & Vision

    A one-page strategy document outlining the business problem, product vision, strategic objectives, and success measures.

  • 02Current-State vs. Future-State

    A visual comparison of current state plant-specific processes and the future state standardized workflows.

  • 03Application Inventory & Evaluation

    An inventory of existing applications and the evaluation for integration with M3 or deprecation based on business value.

  • 0418-Month Product Roadmap

    An outcome-based roadmap showing key initiatives, dependencies, and business value across an 18-month program.

09

Key Takeaways

  • Align on Business Outcomes

    Clear business objectives and stakeholder alignment are essential for successful ERP transformation.

  • Standardize with Flexibility

    A unified process framework with plant-specific flexibility ensures adoption and scalability.

  • Use Data to Guide Decisions

    A centralized data lake and consistent reporting enable faster, more informed decision-making.

  • Build for the Future

    A modern finance platform and clean data foundation enable continuous improvement and future AI opportunities.

Manufacturing Finance Platform Strategy

Unified. Standardized. Scalable. One-page strategy, Northstar Manufacturing (fictional).

Business problem

Eight plants run finance and accounting on their own processes, charts of accounts and systems. Data is inconsistent, closing the books takes 8 days, and leaders cannot see performance across plants without manual consolidation.

Product vision

One finance platform on Infor M3 where every plant follows a standard process, data lives in one place, and finance teams get accurate reports without building them by hand.

Strategic objectives

  • Standardize F&A processes and the chart of accounts, with documented plant-specific variations
  • Move all plants to Infor M3 in waves
  • Consolidate financial and operational data in a central data lake
  • Offer standard reports and self-service analytics in Tableau
  • Retire applications that M3 replaces

Success measures (targets)

  • 30% fewer manual processes
  • Month-end close from 8 to 6 days
  • 99% data accuracy in financial reports
  • 40% more self-service reporting adoption
  • 20% lower application maintenance costs

Principles

Standard by default, flexible by exception. Data foundation before advanced analytics. Every phase delivers something plants can use.

From Plant-Specific Processes to a Unified Model

AreaCurrent stateFuture state
ProcessesEach plant has its own workflows, approvals and documentationOne standard F&A process, with plant-specific variations documented and approved
Chart of accountsDifferent structures by plant and divisionOne chart of accounts used by all eight plants
SystemsLegacy ERPs, in-house applications, spreadsheets, third-party toolsInfor M3 at the core; other tools integrated only where they add value
DataSeparate stores with different definitionsA central data lake with shared definitions
ReportingManual, ad hoc, different formats by plantStandard reports and self-service dashboards in Tableau
Month-end close8 days, heavy manual reconciliation6 days (target), automated reconciliations

Synthetic scenario.

Application Inventory & Evaluation

ApplicationTypePurposeDecisionWhy
PlantCostProIn-houseCost trackingIntegratePlant-specific costing logic M3 does not cover; feeds M3 through an interface
InvTrackIn-houseInventory managementDecommissionM3 inventory module covers it; removes duplicate data entry
QualityNetThird-partyQuality controlIntegrateSpecialized and well adopted; quality cost data flows to M3
FleetOpsThird-partyFleet and assetsDecommissionAsset management moves to M3; contract ends in Q5
Analytics HubThird-partyReportingReplaceReplaced by standard reports and Tableau on the data lake

Fictional application names. Each one was scored on business value, overlap with M3, cost to keep and risk to replace.

18-Month Product Roadmap

PhaseWhenKey deliverablesBusiness value
Discovery & PlanningQ1 to Q2Process maps for eight plants, application inventory, business caseShared picture of the problem; funded plan
Process StandardizationQ2 to Q3Standard F&A processes, one chart of accountsConsistent data from the start of M3
Infor M3 ImplementationQ2 to Q5Plants move to M3 in waves, pilot plant firstOne system of record for finance
Data Lake & IntegrationsQ3 to Q5Central data lake, interfaces for kept applicationsSingle source of truth
Reporting & AnalyticsQ4 to Q5Standard financial reports, Tableau self-serviceFaster close, less manual reporting
Application DecommissionQ5 to Q6Retire replaced applicationsLower maintenance costs
Change Management & TrainingQ6Training for all finance users, support modelAdoption that lasts

Dependencies: process standardization before each plant's M3 wave; data lake before self-service reporting; decommission only after the replacing capability is live.

Want to talk through how I'd approach your product?

Let's Connect